Chapter One Product introduction
1.1 Product Overview
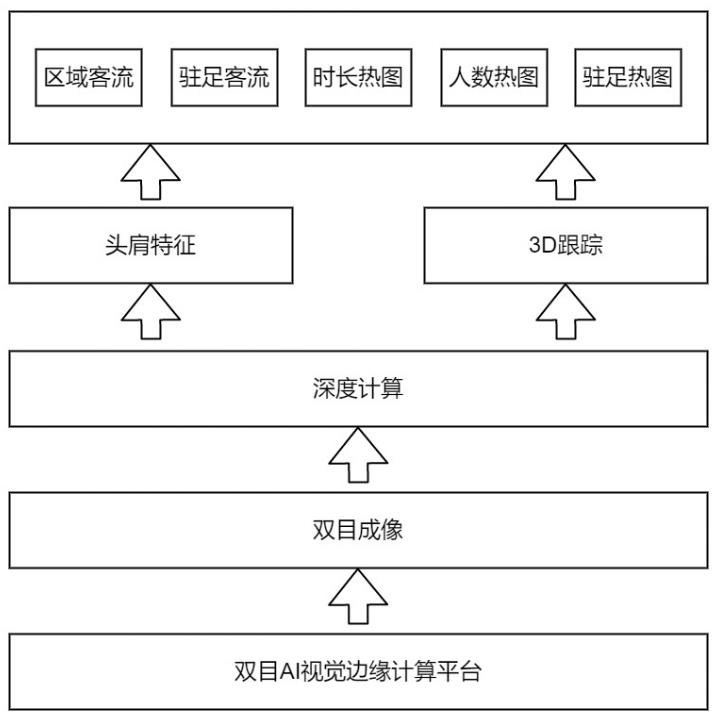
The product of passenger flow and heat area in binocular 3D area obtains 3D depth information in real time through binocular AI sensor, identifies the head and shoulder features in complex scenes based on the head and shoulder feature algorithm, and realizes accurate 3D human tracking through the human body tracking algorithm. Based on this technology, the information of passenger flow, stop and heat in the set area is statistically analyzed. So as to realize the passenger flow statistics and thermal analysis function of the region.
1.2 Product Features
(1) High statistical accuracy
- Based on the leading binocular stereo vision technology, it gets rid of the limitations of traditional 2D products which are easily affected by light and scene.
- Based on the leading fisheye binocular imaging technology, the available field of view Angle is increased to 140x120 degrees, and the coverage range of 9mx6m can be realized at 3.5m.
(2) The reference frame of the visual view is clear
- Thanks to the 3D human body detection and tracking technology, the thermal map reference system refers to the ground instead of based on the human head, so it is easier to use in the secondary development of the data. At the same time, the data is accurate and not affected by different heights of people
(3) Provide both thermal map and thermal data;
- It not only provides the thermal data after rendering, but also provides the accurate data behind the thermal map. Customers can do qualitative research or quantitative analysis;
- It provides multi-dimensional data such as duration, number of people and number of people who stop, with richer data.
(4) Edge computing, simple deployment
- Benefiting from leading 3D tracking technology, no more scene optimization is required after product deployment
- Adopting the all-in-one mode, there is no need to add edge computing boxes and other devices
1.3 Function Description
This product contains four sub-functions, as shown below:
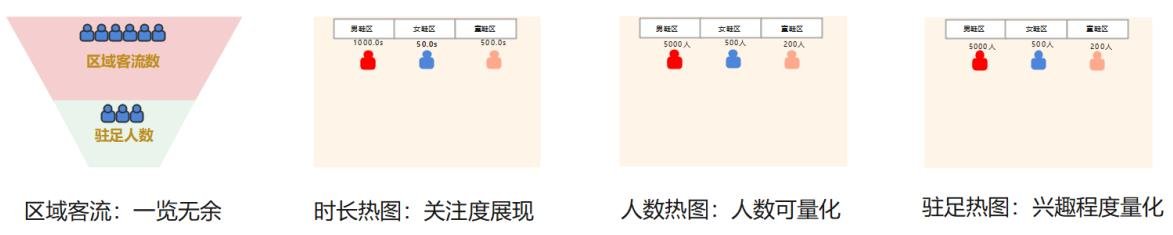
1.3.1 Definition of regional passenger flow
Regional passenger flow is divided into two data dimensions: total regional passenger flow and regional stopping passenger flow.
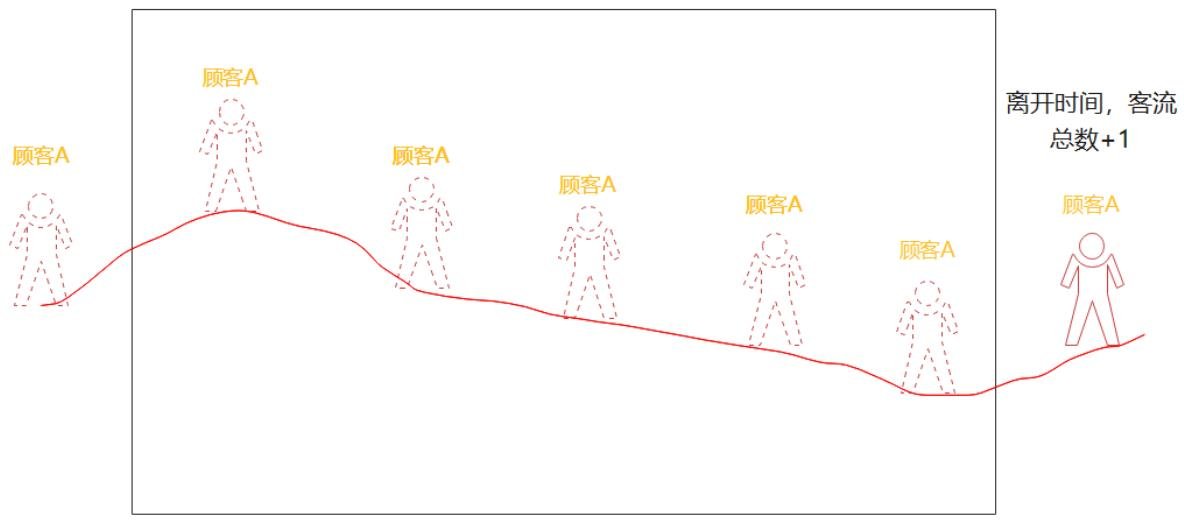
(1) Total regional passenger flow
For each customer, from entering the observation area to leaving the observation area, the total number of passenger flows will be +1.
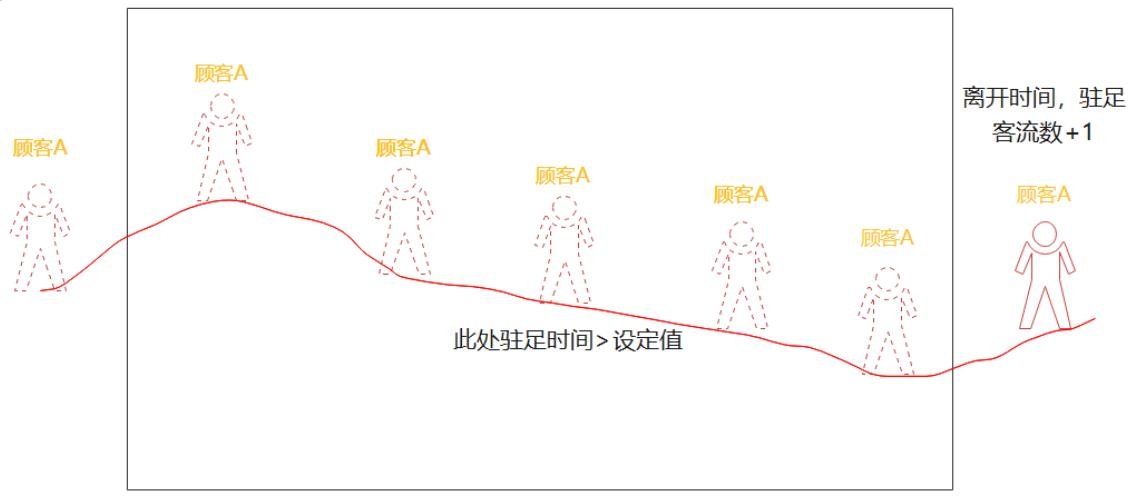
(2) Passenger flow in the area
If a customer entering the observation area stops at a point in the area for more than the set time (currently 3S), the number of passengers stopping in the area will be +1.
1.3.2 Duration Heat map
The floor is divided into grids. Each grid, as a unit, accumulates the total time spent in the grid by all customers. This data dimension reflects the heat passed through each small area on the floor.
1.3.3 Heatmap of head count
Each grid on the ground, as a unit, accumulates the total number of customers that have appeared in this grid, which reflects the specific distribution of the number of people data.
1.3.4 Stop heat map
Each grid on the ground is used as a unit to accumulate the total number of customers who have stopped in this grid, so as to analyze the degree of interest of customers in different locations.
Chapter Two Product Technical Parameters
2.1 Performance Parameters
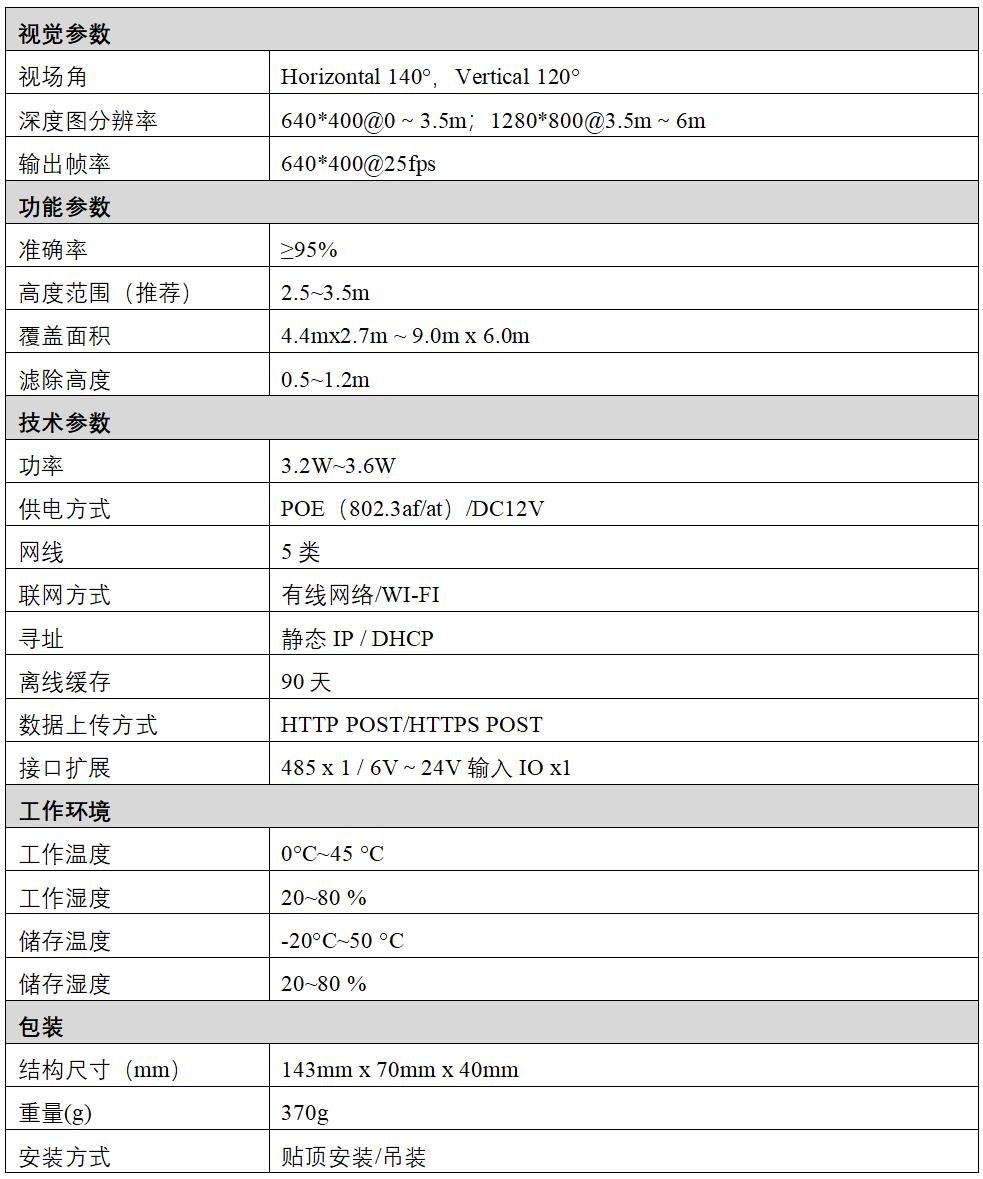
2.2 Function Parameters
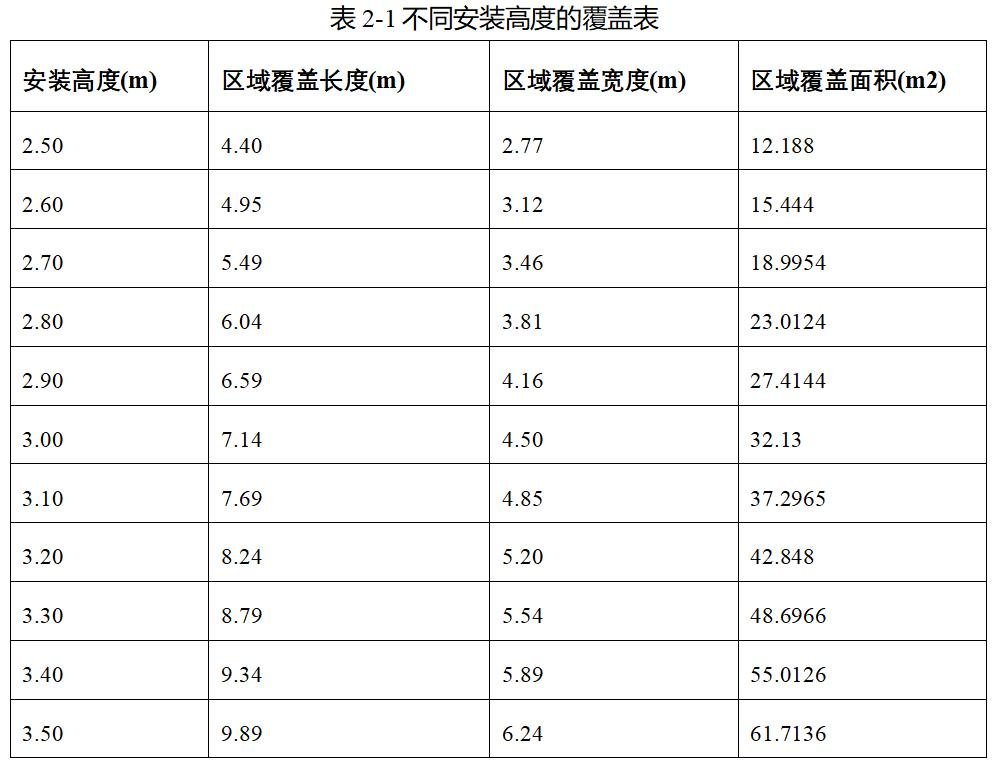
For regional passenger flow, one of the most important indicators is coverage. The coverage of the equipment installed at different heights is shown in Table 2.1.
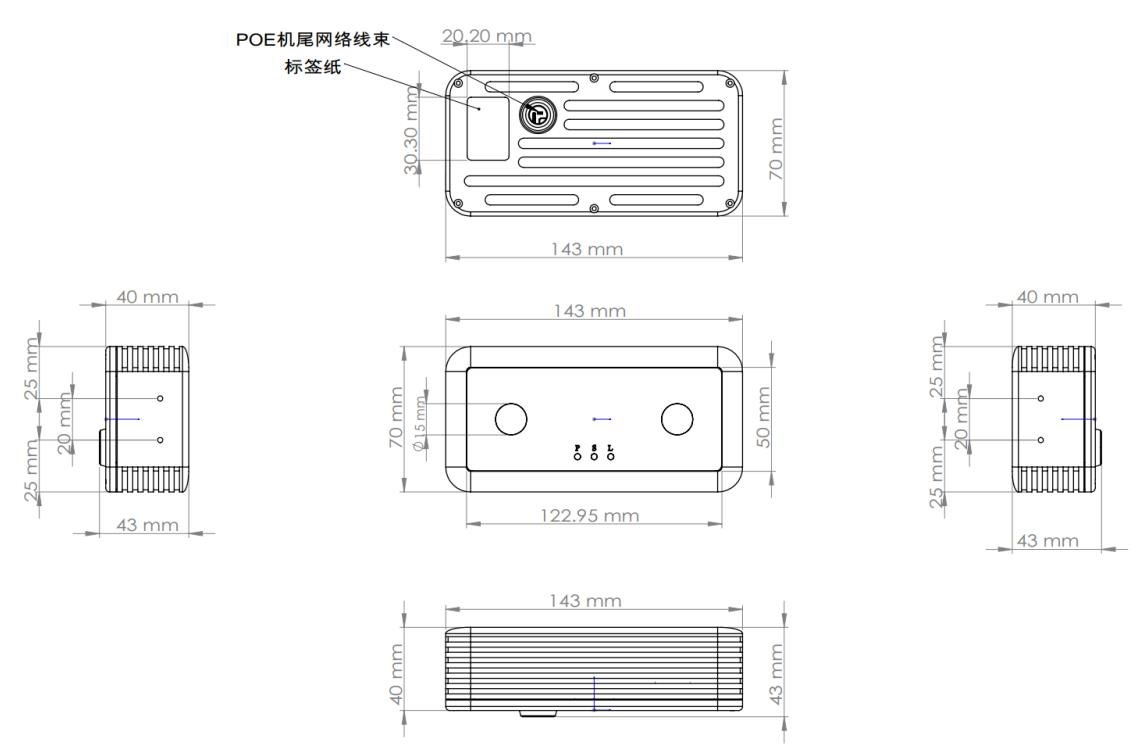
2.2 Mechanical Parameters
Chapter Three Quick Use Instructions
3.1 Installing Devices
3.1.1 Ceiling installation
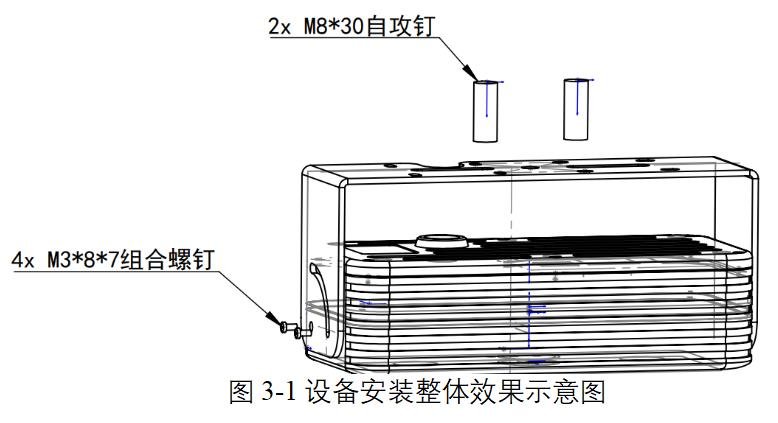
The passenger flow equipment can be mounted with rotating suspension support in a top-lifting manner. The overall effect is shown in Figure 3-1. The specific steps are described as follows.
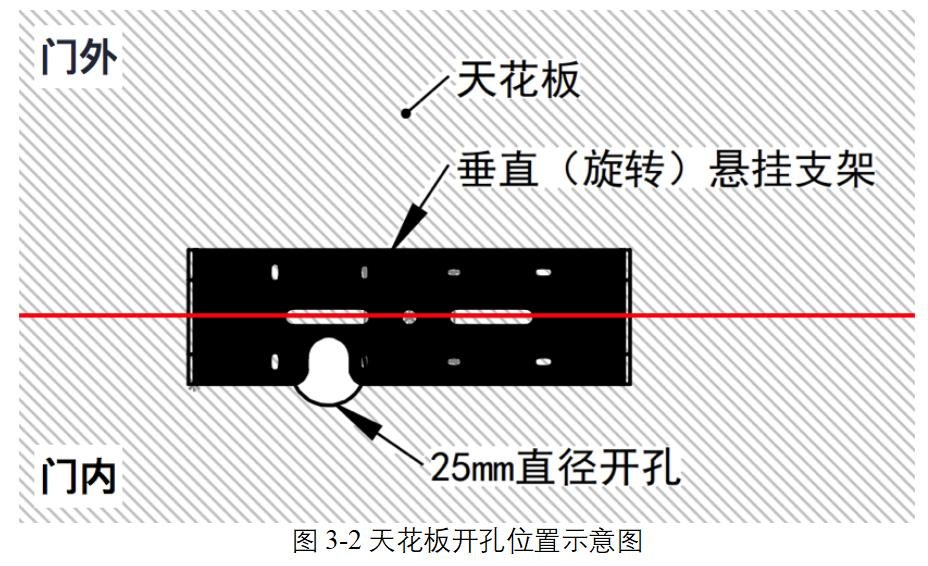
Step 1: Determine the installation position
For ceilings with easy cutting materials such as wood, a 25mm diameter through hole should be taken out at the lower left corner of the rotating hanging bracket to hide the wiring harness. The installation directions of the support are as follows: the 25mm diameter opening of the support faces inside the door, as shown in figure 3-2.
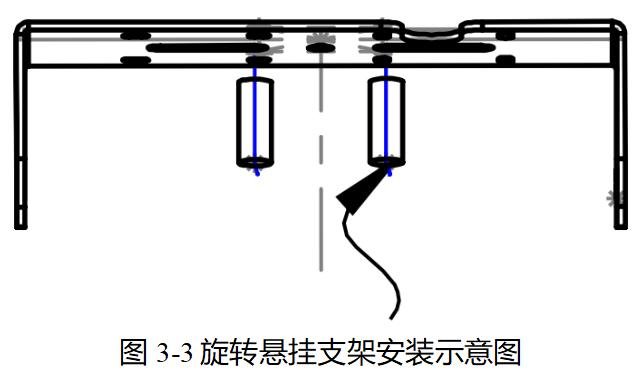
Step 2: Install the support
Fix the rotating suspension bracket to the ceiling using two M8*30 tapping nails, as shown in Figure 3-3.
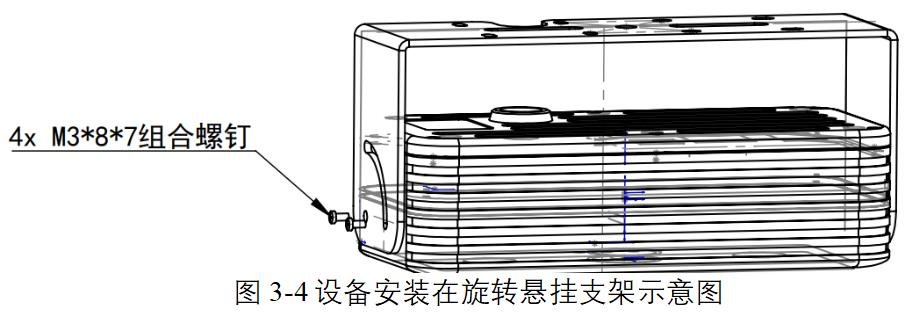
Step 3: Install the device
Install the device on the rotating suspension support using four M3*8*7 screws, as shown in Figure 3-4. Do not tighten the screws in this step. Tighten the screws after completing Step 4.
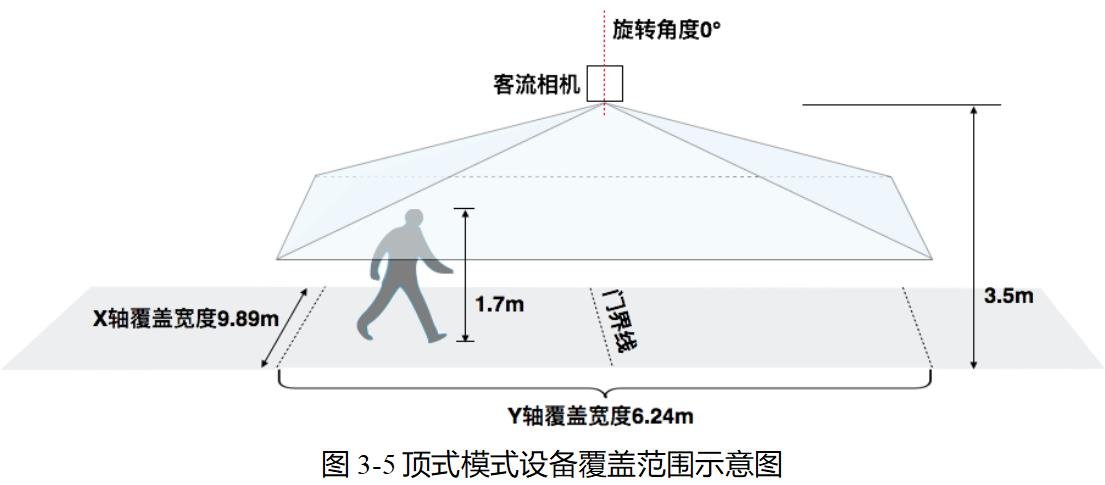
Step 4: Determine the mounting height
The installation height of the device ranges from 2.5m to 3.5m. For details about the installation height and coverage, see Table 2-1. Figure 3-5 shows the installation height of the device at 3.5m.
Step 5: Clean the device
Check whether the glass surface on the front of the device is dirty. If yes, wipe it with a cleaning cloth. Then complete the installation.
3.1.2 Hoisting and Installation
The passenger flow equipment with rotating suspension bracket and duck bill bracket monitoring hoisting telescopic bracket can realize hoisting installation, the specific steps are as follows.
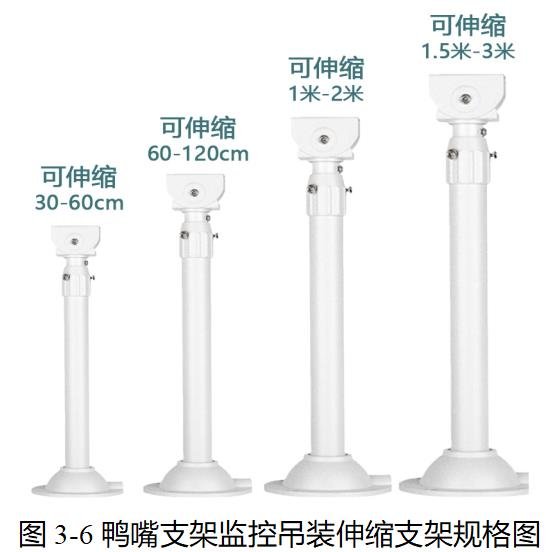
Step 1: Specification selection of duck bill bracket
Select a duck bill support based on the installation height. The telescopic support supports an expansion length of 0.3m to 3m, as shown in Figure 3-6:
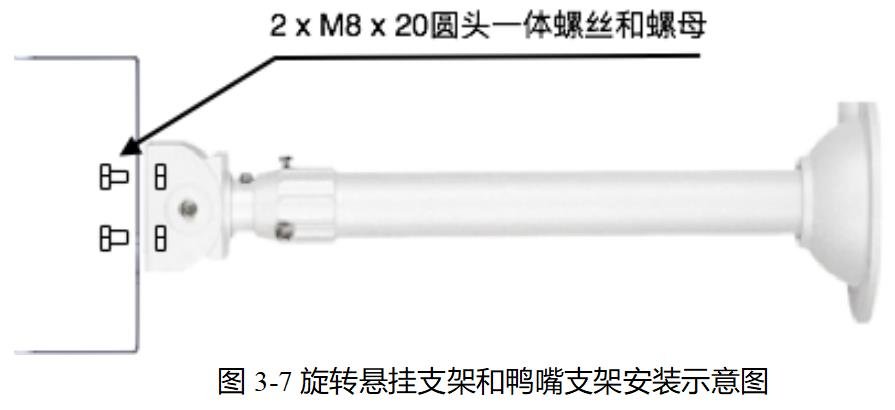
Step 2: Assemble the bracket
Fix the rotating suspension bracket to the duckbill bracket using two M8*20 round-head integrated screws (including flange nuts), as shown in Figure 3-7.
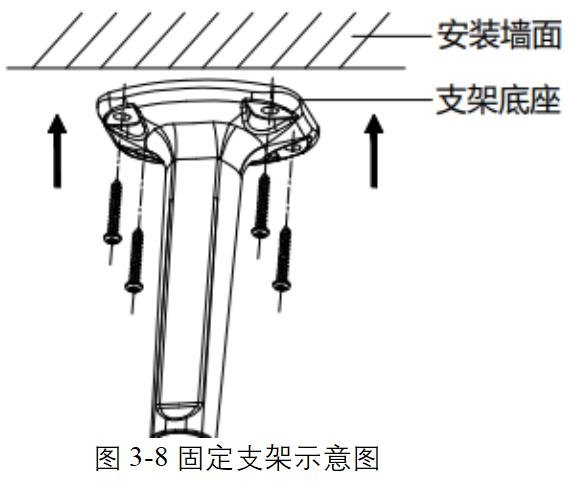
Step 3: Secure the bracket
Use self-tapping screws or expansion screws to secure the base of the duck bill mounting bracket to the mounting wall, as shown in Figure 3-8. Note: Put the network cable into the inner tube of the hoisting bracket in advance when installing.
Step 4: Install the device
Refer to "Step 3" in the ceiling installation guide.
Step 5: Determine the installation height and adjust the Angle of the device
Refer to "Step 4" in the ceiling installation guide.
Step 6: Clean the device
Check whether the glass surface on the front of the device is dirty. If yes, wipe it with a cleaning cloth. Then complete the installation.
3.2 Connecting Devices
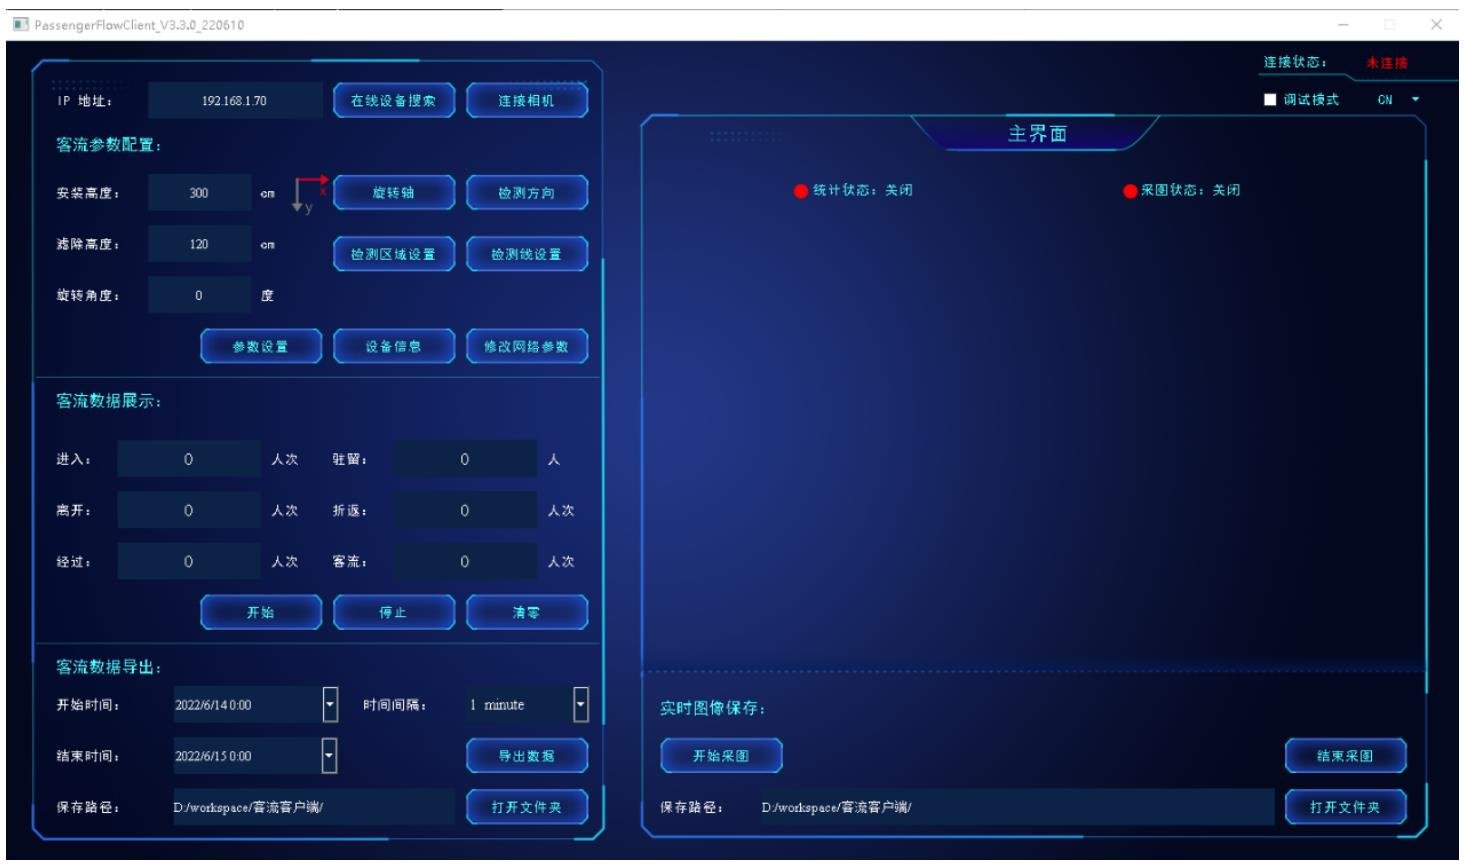
Prepare a PC, connect the PC and the device to the same POE switch, and connect the POE switch to a router. The router provides the dynamic IP address acquisition function. After the device is connected, it opens the device debugging software PassengerFlowClient_VXXXX. exe on the computer, as shown in the following figure.
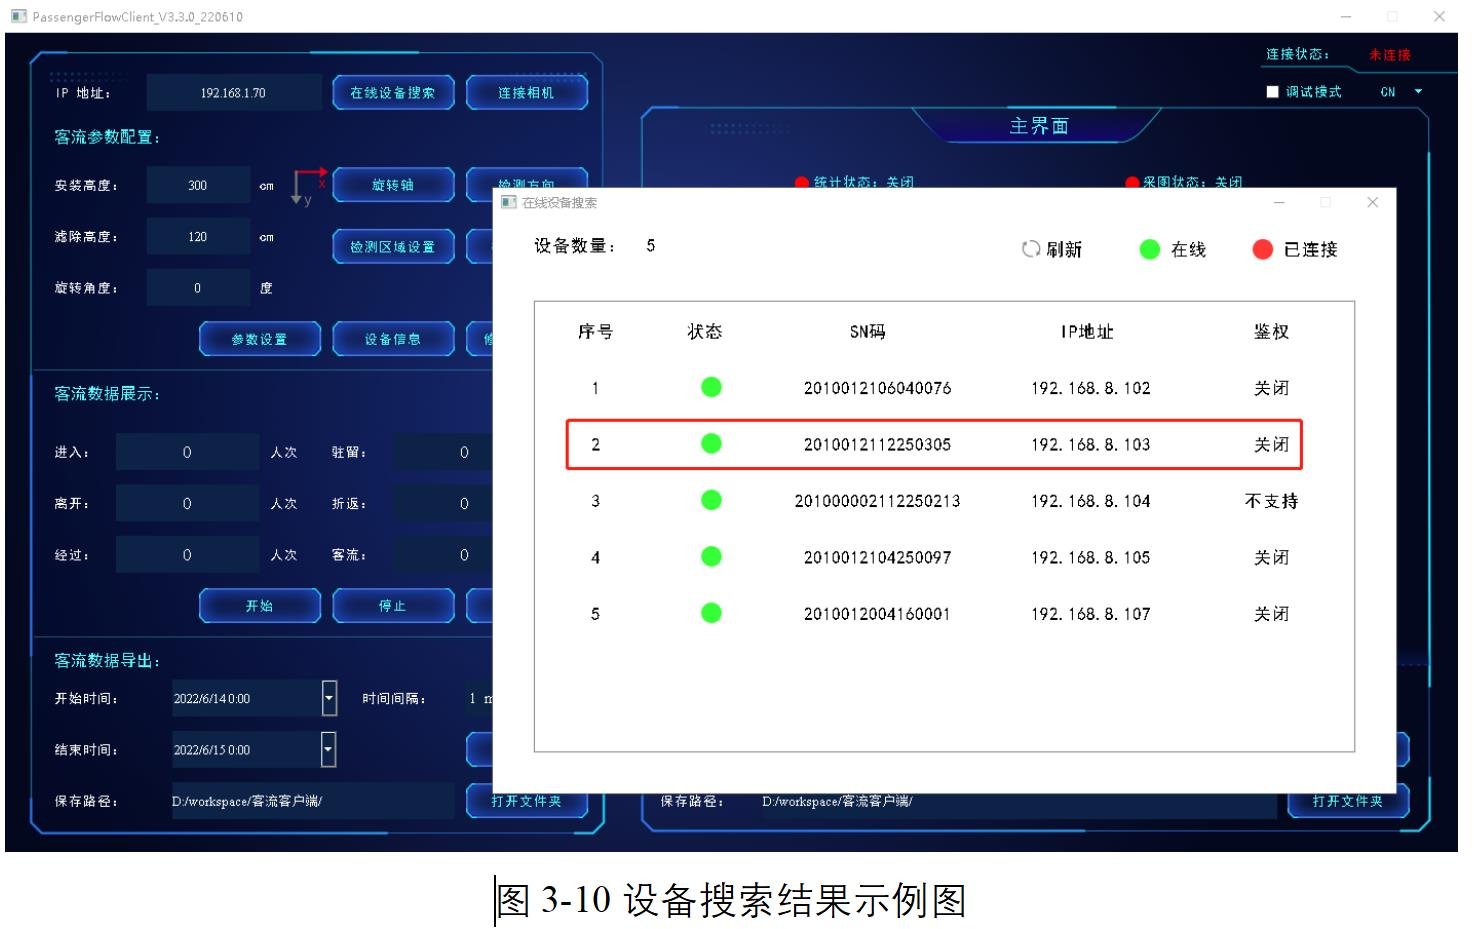
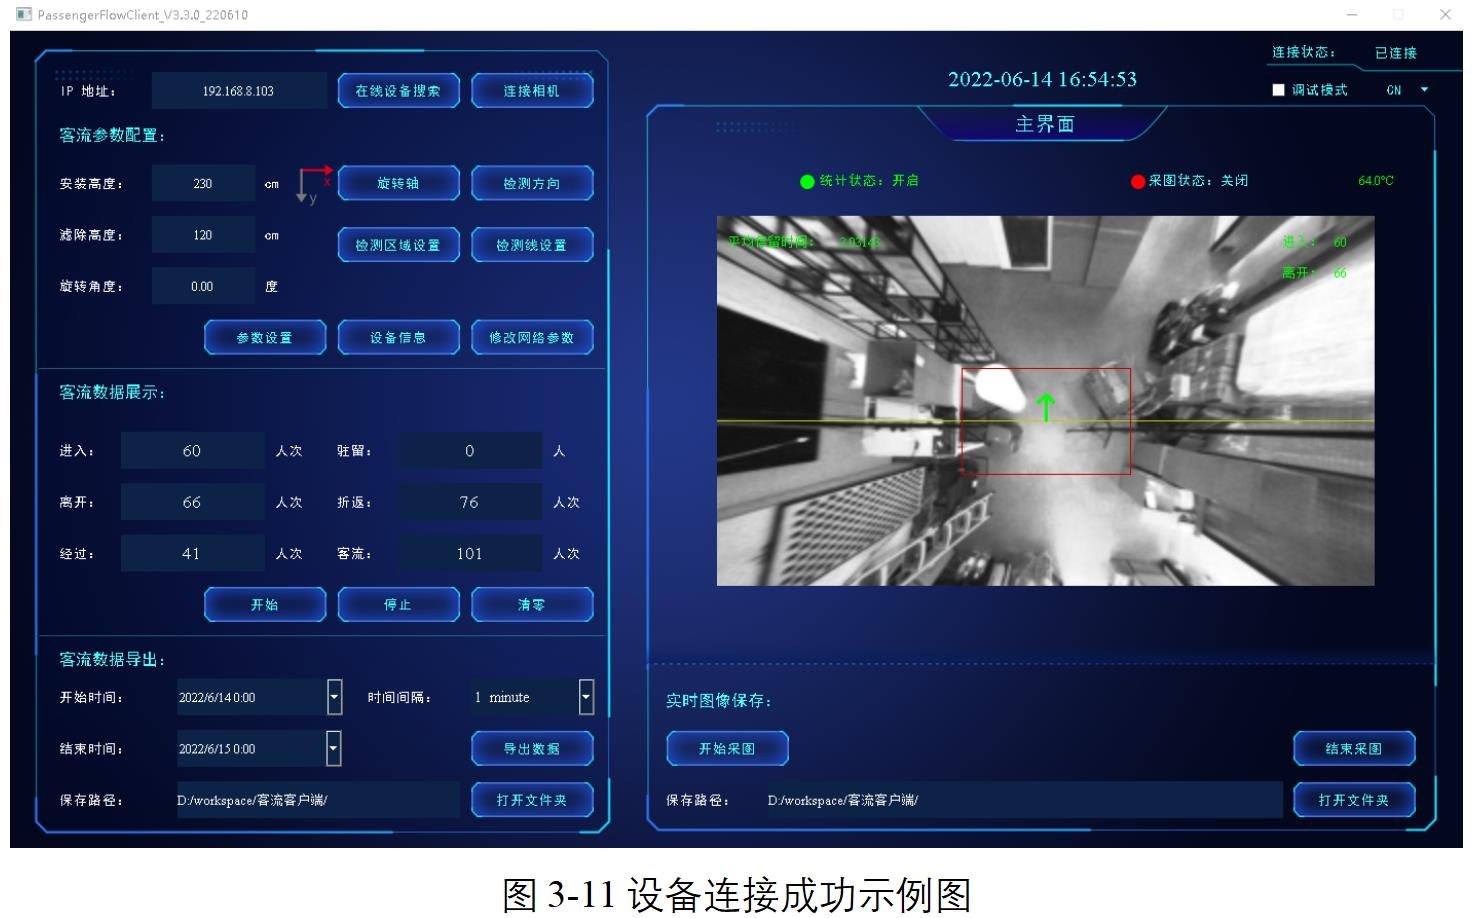
Click Online Device Search to search for connected devices. Figure 3-10 shows the search results. Double-click any line to select the device, and click Connect Camera to connect the device. Figure 3-11 shows a successful connection example.
3.3 Parameter Settings
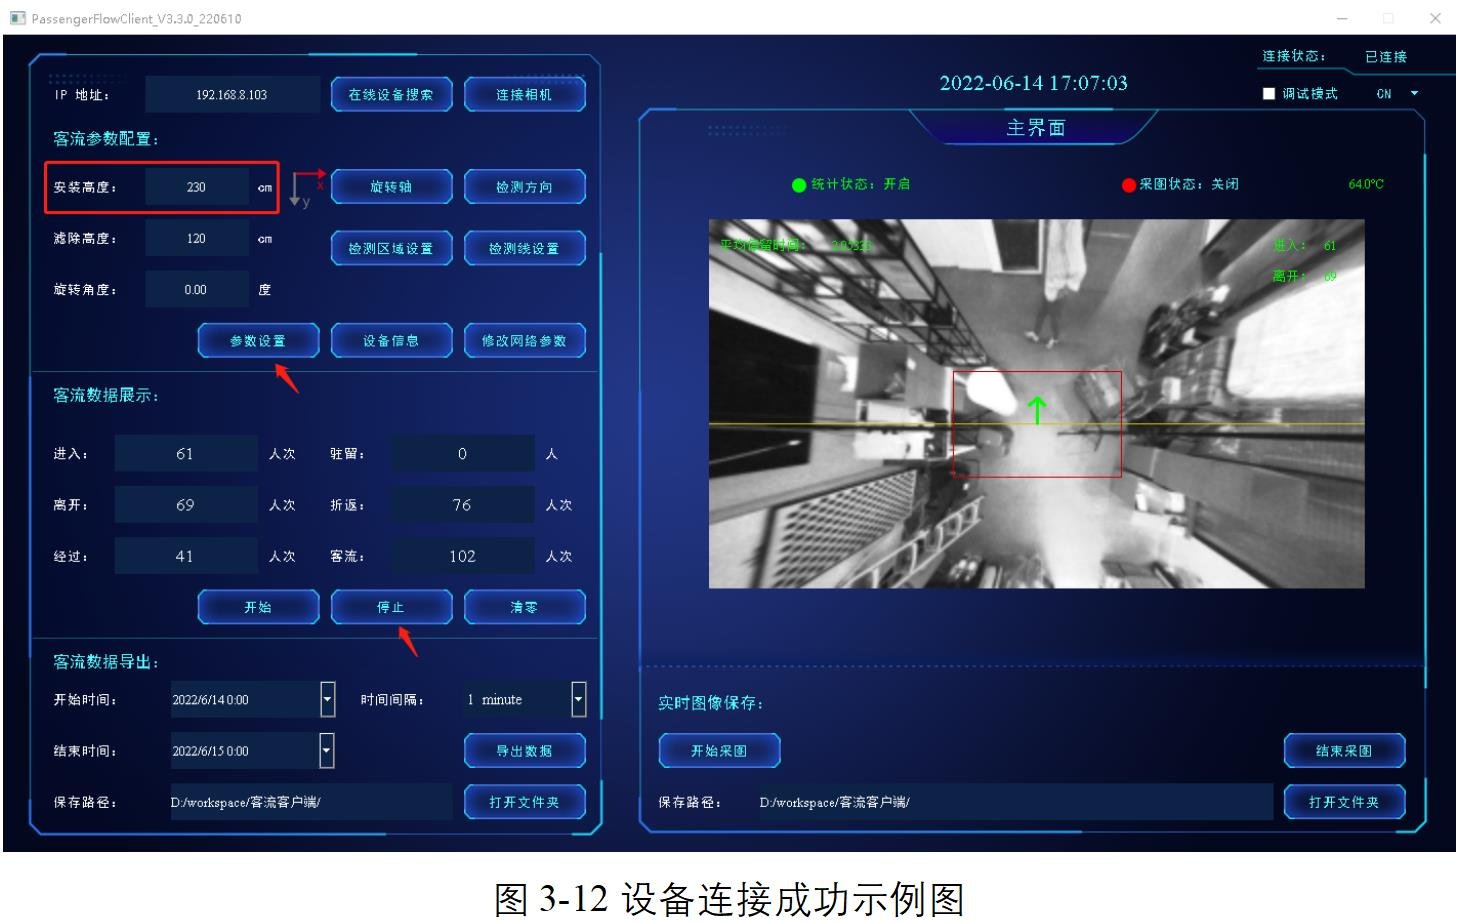
After the device is successfully connected, set the installation height of the device correctly. If the camera is installed at a height of 3.0m, enter 300 (in cm) in the Mounting height dialog box. Filter Height and Rotation Angle can retain their default values unless required. After completing the filling, click the "Parameter Setting" button. If "Please stop the statistics first and then set the height parameter" is prompted, click the "Stop" button first and then click the "Parameter Setting" again. After setting parameters, click the "Start" button, and the device enters the statistical state. Figure 3-12 shows an example for setting parameters.
3.4 Quick Function Experience
(1) Passenger flow
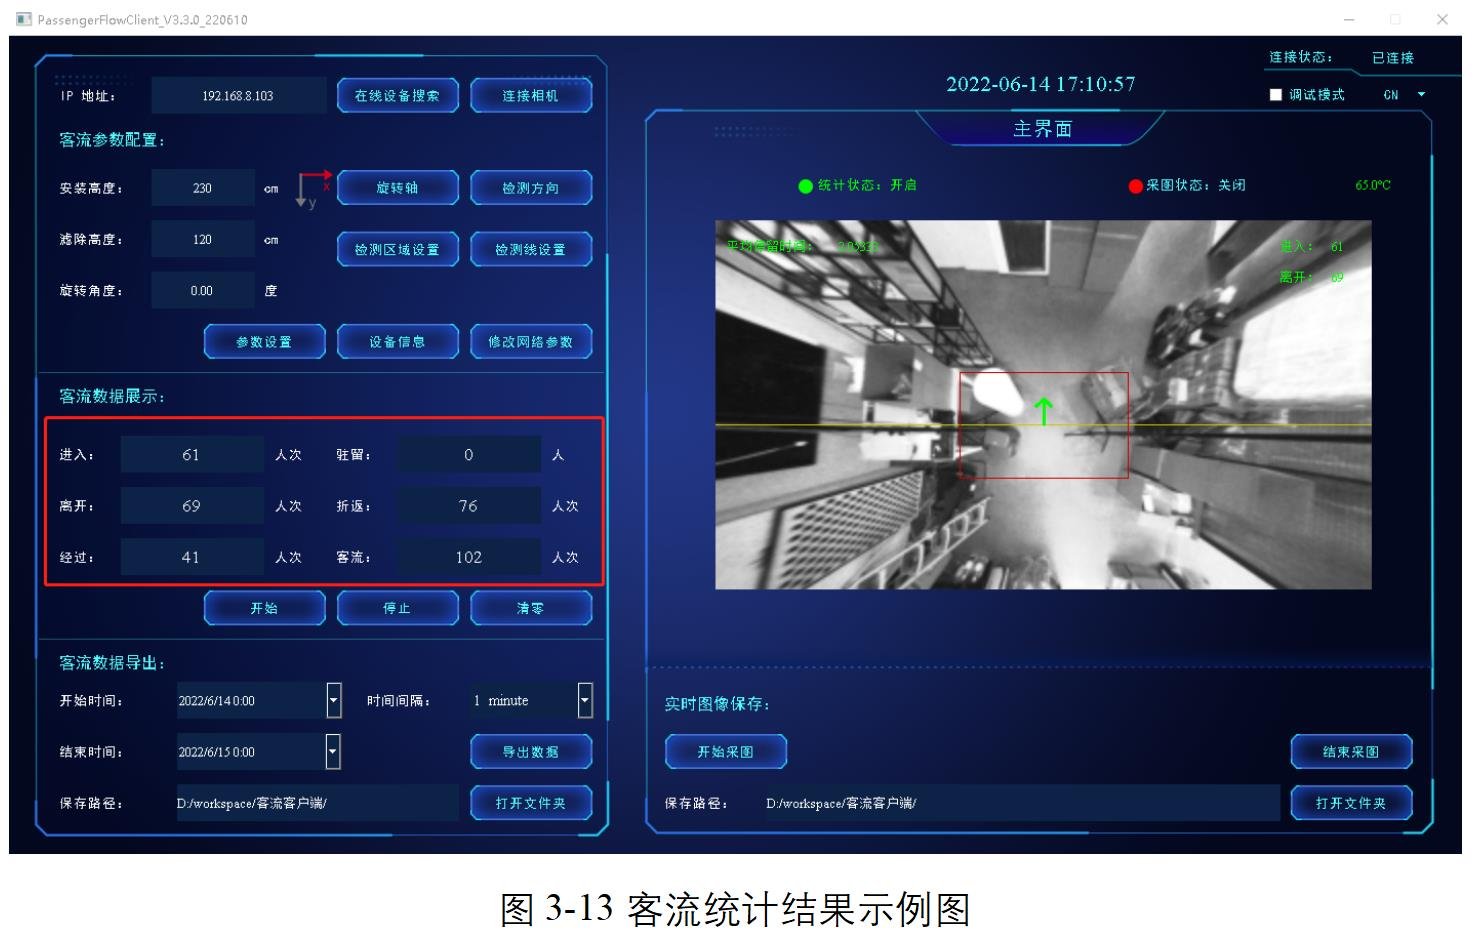
After a device enters the statistics state, it can collect statistics on the number of passengers entering, leaving, passing, reentry, and dwell in real time, as shown in Figure 3-13.
(2) Duration thermal map
Click the "Device Information" button, and then under the "Basic Information" TAB of the Device information dialog box, select the "Original Heat map - Time" option from the "Obtain Heat Map" drop-down box, and click the "Obtain Heat Map" button to obtain the duration heat map, as shown in Figure 3-14.
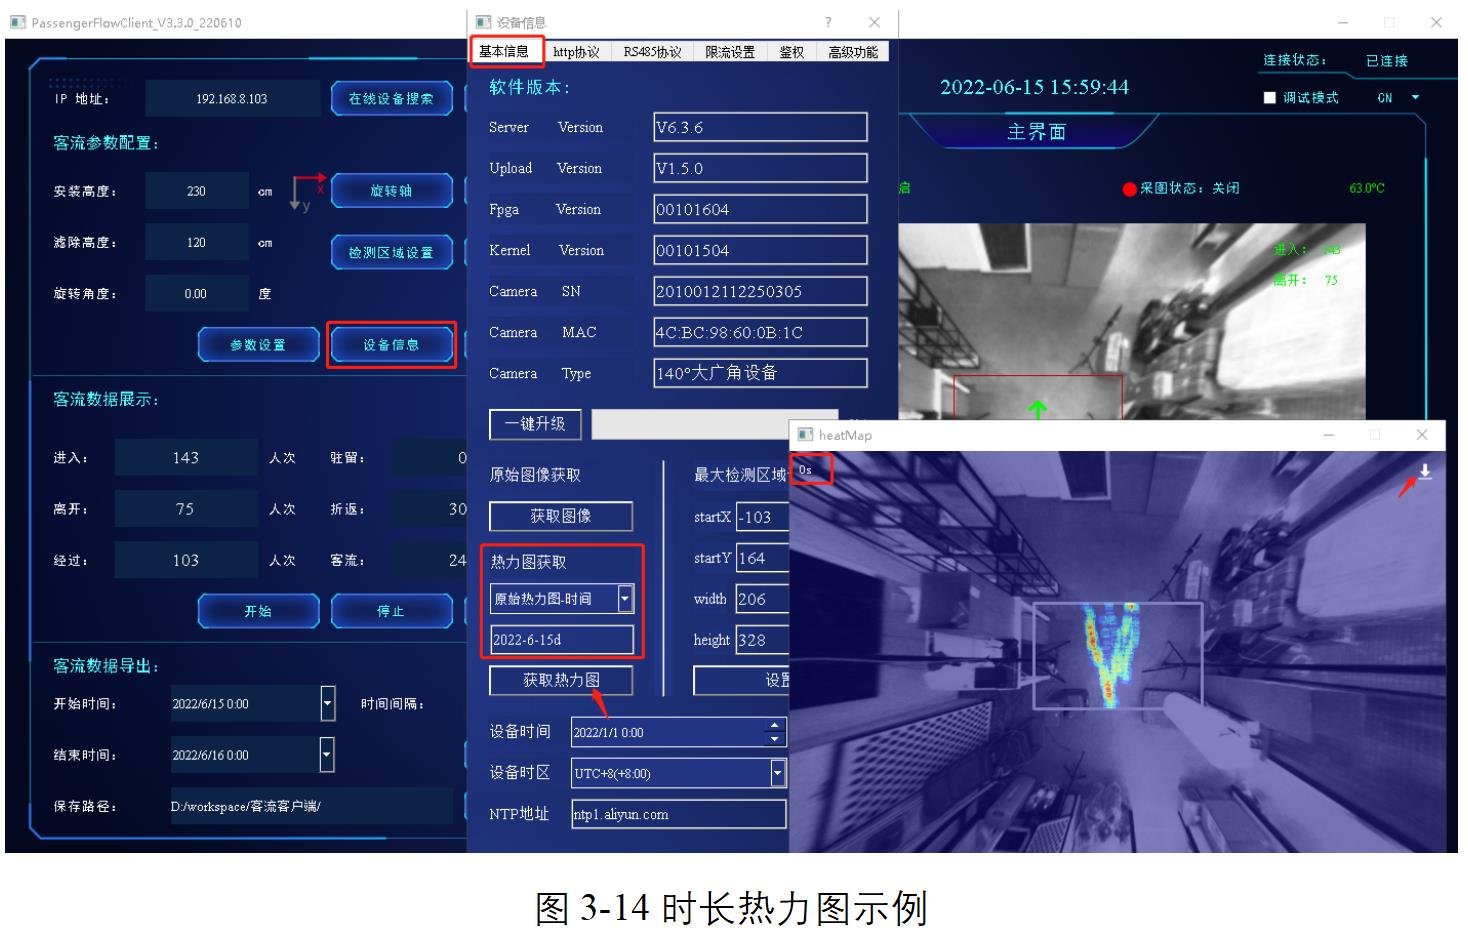
When the mouse is moved to any position of the thermal map, the time thermal data of the current coordinates can be displayed in real time. There is a data export button in the upper right corner of the thermal map. Click this button to export the current data. The exported data include the time thermal rendering diagram, the original data of the time thermal map and the passenger flow data table. The data are described as follows:
- Duration thermal map: 640 * 400 resolution JPG image, name such as 2022-6-15d-image-time.jpg;
- Original duration thermogram data: contains two 16-bit 640 *400 resolution PNG images, one of which represents the low 16-bit dwell time data (2022-6-15d-time-low. PNG), and the other represents the high 16-bit dwell time data (2022-6-15d-time-high. PNG). Duration of thermal map at each point stay duration = high 16 data x 65536 + low 16 data;
- Passenger flow data table: contains dimensions such as the number of passengers, the number of people who stop and the average length of stay, such as 2010012112250305_2022-06-15_2022-06-16_3600.XLSX. The stationary data dimension is only effective in obtaining stationary heat map.
(3) Human thermal map
Click the "Equipment Information" button, and then under the "Basic Information" TAB of the "Equipment Information" dialog box, select the "Original Heat map - person-time" option from the "Obtain Heat Map" drop-down box, and click the "Obtain Heat Map" button to obtain the person heat map, as shown in Figure 3-15.
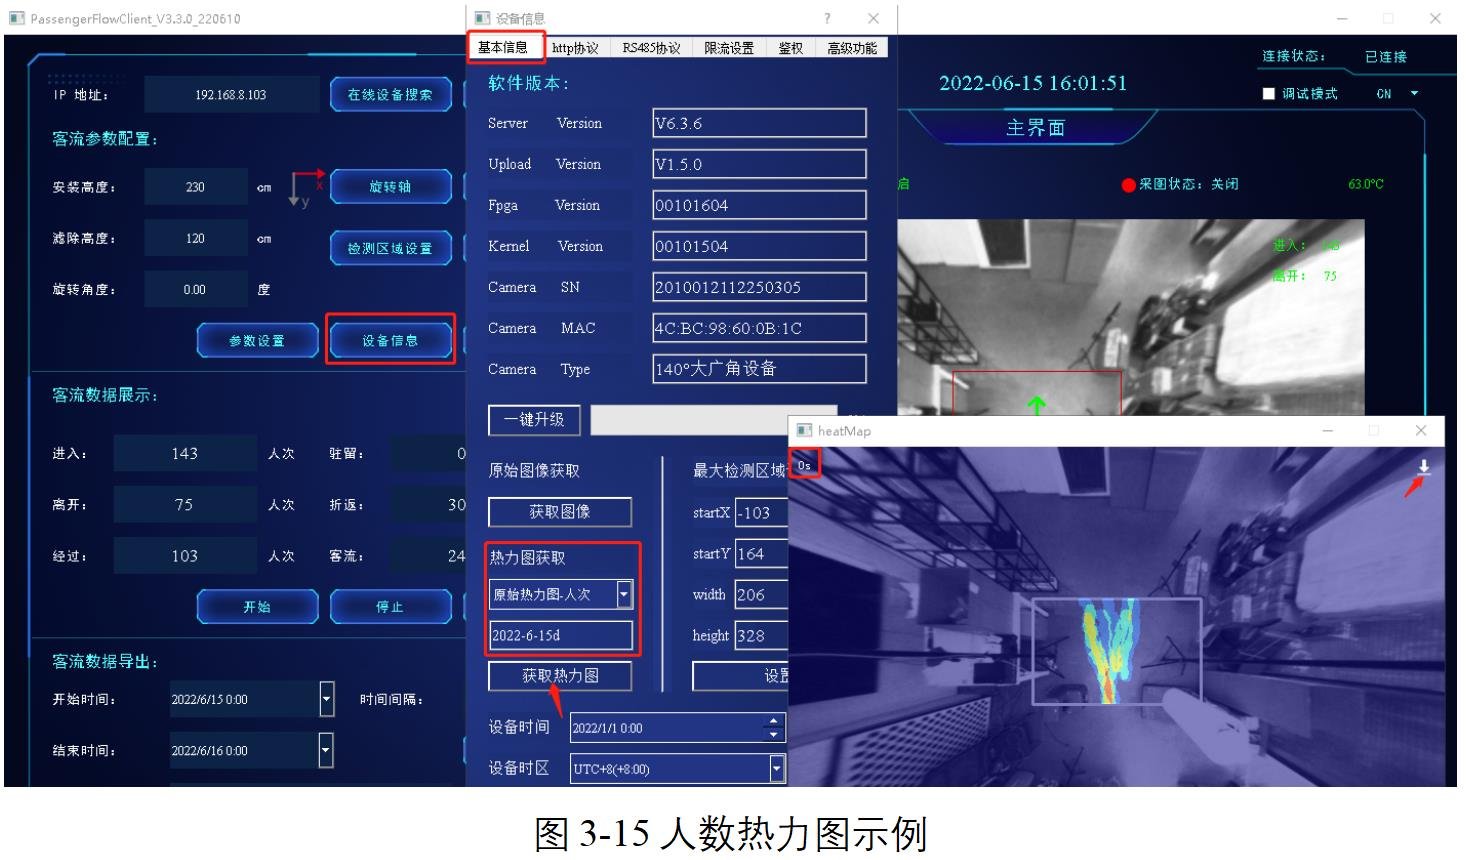
Moving the mouse to any position of the thermal map can display the current coordinate thermal data in real time. There is a data export button in the upper right corner of the thermal map. Click this button to export the current data. The exported data include the thermal rendering diagram of the number of people, the original data of the thermal map of the number of people and the passenger flow data table. The data are described as follows:
- Thermogram: JPG image with 640 * 400 resolution, name: 2022-6-15d-image-person.jpg;
- Original data of head thermogram: 16-bit PNG image with 640 *400 resolution, each point on the image represents the cumulative number of people passing through the point;
- Passenger flow data table: contains dimensions such as the number of passengers, the number of people who stop and the average length of stay, such as 2010012112250305_2022-06-15_2022-06-16_3600.XLSX. The stationary data dimension is only effective in obtaining stationary heat map.
(4) Stationary thermal map
Click the "Device Information" button, and then under the "Basic Information" TAB of the "Device Information" dialog box, select the "Original Thermal map-stop" option in the "Obtain Thermal Map-drop down box, and click the" Obtain Thermal Map-Stop "button to obtain the stationary thermal map, as shown in Figure 3-16.
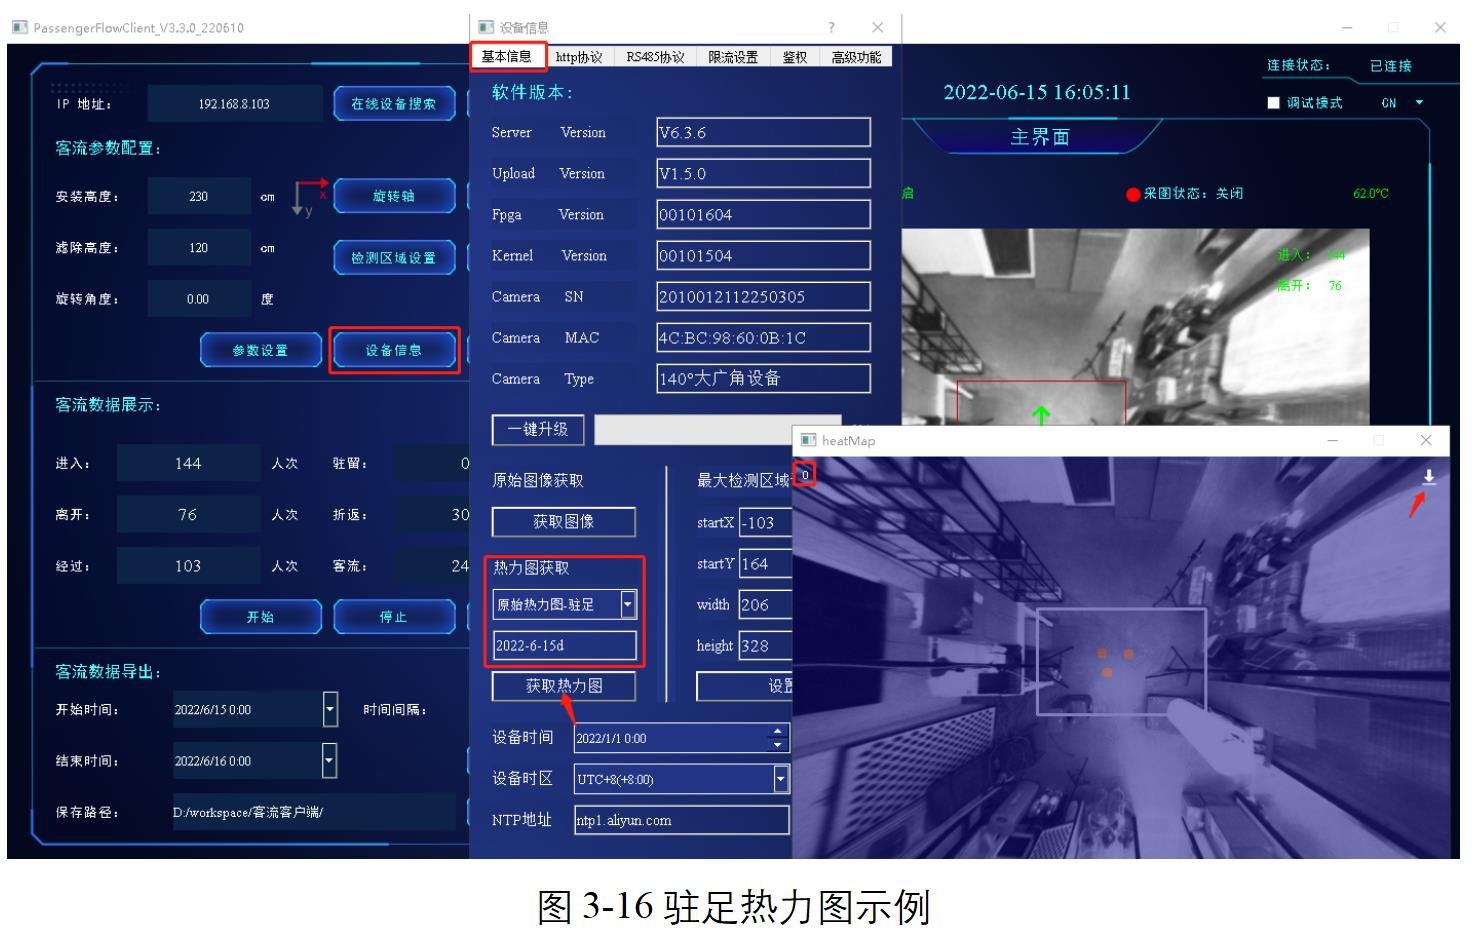
By moving the mouse to any position of the thermal map, the stationary thermal data of the current coordinates can be displayed in real time. There is a data export button in the upper right corner of the thermal map. Click this button to export the current data. The exported data include thermal rendering map of stop, original data of thermal map of stop and passenger flow data table, and the description of each data is as follows:
- Thermal map: 640 * 400 resolution JPG image, name such as 2022-6-15d-image-stopevent.jpg;
- Original data of head thermogram: 16-bit PNG image with 640 *400 resolution. Each point on the image represents the cumulative number of people stopped at the point.
- Passenger flow data table: contains dimensions such as the number of passengers, the number of people who stop and the average length of stay, such as 2010012112250305_2022-06-15_2022-06-16_3600.XLSX.
Chapter Four Applicable Scenario
4.1 Illumination Conditions
- Normal lighting: refers to the indoor normal lighting environment in shopping centers/stores/restaurants;
- Street half sunlight: refers to the scene where the street sunlight directly enters the door;
- Direct sunlight: indicates an outdoor scene with direct sunlight.
- Dimly lit: in a dimly lit scene such as a parking lot/movie theater/bar;
- No light environment: ambient lighting can be considered
4.2 Surrounding Environment
- Ground: suitable for various materials/colors of the ground environment;
- Surrounding: applicable to the scene with walls around/opening and closing doors;
Chapter Five Product work requirements
5.1 Power Supply Requirements
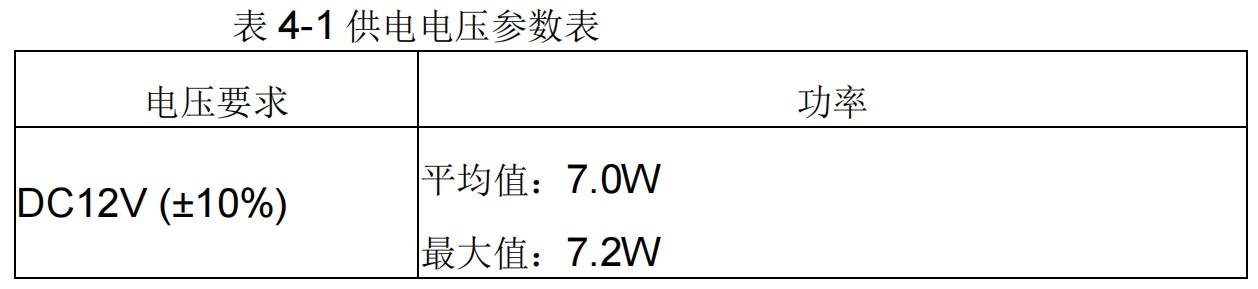
The device can use a 12V/2A switching power adapter or POE power supply. Table 4-1 lists the voltage parameters.
Attention :
- Using an incorrect power supply may damage the device.
- Do not use power supply with voltage greater than DC12V (±10%);
- The device supports only the following working modes and does not support both wired and wireless working scenarios:
- Wi-fi connection network and DC12V power supply mode;
- POE power supply and wired network connection;
- Wired network and DC12V power supply;
5.2 Storage and working Environment Requirements
- Operating temperature: 0°C~45 °C;
- Working humidity: 20~ 80%;
- Storage temperature: -20°C~50 °C;
- Storage humidity: 20~ 80%;
Note: Efficient heat dissipation must be provided to maintain a stable indoor temperature. The following guidelines must be observed. In all cases, the indoor temperature must be monitored and ensured that the temperature does not exceed 50 °C.
5.3 Device Connectors
The binocular passenger flow product leads to two connectors at the rear, DC JACK and Ethernet respectively. The Ethernet port provides data transmission and POE power supply, and the DC JACK port provides 12V power supply.
Attention :
- The use of power supply higher than 12V (±10%) will damage the product;
- A standard POE power supply device is recommended. Non-standard POE power supply devices may damage the device.
For more information, please pay attention to the official account of "Wanfu Official Service"